This lab assignment is a midterm term project that must be completed independently. You may consult the ninjas on general Java questions, or clarification of the problem, but you should design and implement your solution independently. In this assignment, you will be constructing a tree in which each node can have up to seven children. By traversing your tree, you will be able to extract a river network from a terrain.
Terrain Modeling
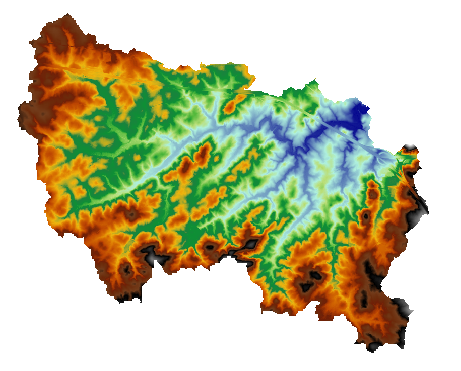
One feature of Geographic Information System (GIS) is the ability to represent terrains as a two dimensional array of elevations. A sample elevation model is shown below. In this false-color image, blue colors indicate lower
elevations while higher elevation are brown and black.
Flow Directions
In addition to simply
storing and displaying such terrain models, a GIS can compute derived products from terrains. For example we can compute the direction of steepest descent or, in other words, the direction water would flow from a given location. An example of such an image is shown below.
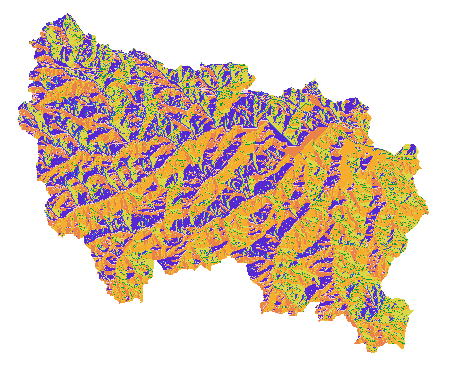
Each pixel in the terrain is assigned a numerical flow direction indicating in
which direction water will flow. The values are encoded as shown in the table
below. A value of 1 indicates water will flow East, while a value of 32
indicates water will flow Northwest. A value of 0 indicates that this pixel is
not part of the actual terrain and should conceptually be ignored.
The image terrain.pgm contains direction values for a sample river
basin. You can open this image the program xv or gimp. You
can also read the image in Java using the Image class described below.
The Image Class
The Image class has been provided for you in your
homework/07/ folder. You do not need to modify this class, though you may choose to modify the test code to become more familiar with the class. You can use this class to read pixel values from an Image (see the operations on
img) or create a new image (see ops on
img2). If you have questions about how the image class works, feel free to ask a ninja or myself for clarification. One important item to keep in mind is that the range of pixel values for any saved image is 0-255 with 0 representing black and 255 representing white. The image is arranged such that pixel (0,0) is in the top left and (rows-1,cols-1) is in the bottom right.
Flow Accumulation
Note that since each pixel in the terrain flows to a single neighboring pixel, each pixel flows to one
parent pixel, but a single pixel might have multiple neighbor pixels that flow into it. We can define a
flow tree on the set of flow directions. The root of this tree is the single pixel that has a non-zero direction, but flows to a pixel that has a direction of zero or is outside the boundary of the image. The children of a node in the flow tree are all pixels that flow directly into the node.
We define the flow accumulation of node in the flow tree recursively as follows. If a node v is a leaf in the flow tree, v has a flow accumulation value of 1. Otherwise, the flow accumulation of v is one plus the flow accumulation values of all of v's children.
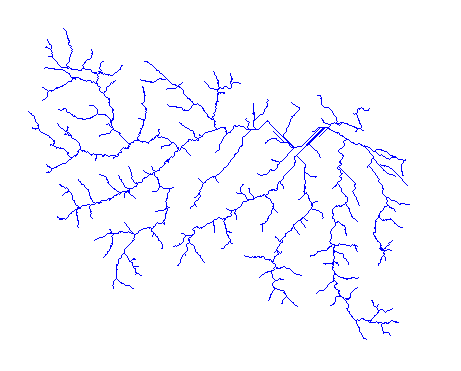
Nodes in the tree with a flow accumulation above a certain threshold value are likely to be rivers and stream. Your assignment is to build a flow tree given a flow direction image and compute the flow accumulation for each cell in the terrain. The output result should be saved in a new image using the Image class. A sample result is shown in rivers.pgm. A similar example is shown below.
In summary every pixel in the grid represents part of a terrain or a null value represented by the image value 0. For every real pixel representing part of the terrain, we can define or compute the following:
- elevation (This is not given to you, you can ignore it)
- flow direction (given in the input image in an encoded format)
- parent pixel (which pixel does this pixel flow to? Computed from flow direction value)
- children pixels (which pixels flow to this pixel? Computed by examining flow directions of neighboring pixels)
- flow accumulation (computed by counting all nodes rooted at or below the node in the flow tree representing the current pixel)
Ultimately you should compute a flow accumulation value for every node in the flow tree and create a final image showing the locations of high flow values, or likely rivers and streams.
Creating the final image
Once you have computed a flow accumulation for every node in the flow tree, you must create a final image that shows the location of high flow accumulation values. Ideally, you would simply write the flow accumulation value of each node in the flow tree to its corresponding pixel in the image. Unfortunately, the flow accumulation values often exceed the maximum image value of 255 and simply linear scaling ends up showing only one major river. To get an image that shows both major rivers and smaller tributaries, you will have to map flow accumulation values to the range 0-255 in a creative and visually appealing way. You are invited to explore ways to adjust the values, but for those short on time, I found the following ranges worked OK for this particular example. First, I determined the maximum flow accumulation value in the flow tree. For the
terrain.pgm the flow accumulation of the root is 316184. Then, for each node, I determine the ratio of the node's flow accumulation to the maximum flow value. This gives me a value in the range 0.0-1.0. Then I map this value to a value in the image as follows.
| pct | img val |
|---|
| 0.10-1.0 | 255 |
| 0.02-0.10 | 128 |
| 0.0004-0.02 | 64 |
| 0.00008-0.0004 | 32 |
| 0.000014-0.00008 | 16 |
| others in terrain | 8 |
| out of terrain | 0 (null) |
The result is shown in
rivers.pgm. You may want to reverse the colors or try another scheme to get a decent contrast.
Warm-up exercises
As always, you should proceed incrementally—adding a few lines of code then compiling and testing. Furthermore here are some warm-up exercises that you might want to solve separately. Some of them will help you solve the project, others will help you understand various aspects of the data/code.
- Draw a simple example of a flow tree and its corresponding flow direction and flow accumulation image. Fewer than 10 nodes will suffice. Make sure you understand the relationship between image values in the grid and conceptual flow direction. You may want to draw a version of the grid with arrows.
- Modify the main method in the Image class to copy the input image to an output image of your choosing. View your image to verify your result.
- Modify the main method in the Image class to flip the input image vertically or horizontally. This will help you clarify any row, column confusion.
- For a given row, column in the image, return the location of the pixel that the given pixel flows to. Note if you are trying to return two items (a row and a column), you will have to create a Position or Location object that can store multiple items. You may have done something similar for the maze class.
- For a given row, column in the image, return the location of the pixels that flow into the given pixel. This method will need to return a List of some kind. For example, the children of the pixel in row 215 col 721 are [(216,720), (215, 720), (214, 720)]. Confirm this.
- Locate the root of the flow tree. This will be an location whose flow direction points to a neighboring pixel with a flow direction of 0, or whose location is outside the boundary of the image. (Solution: the root is at row 215 column 721. You should be able to find this without hardcoding in the solution)
- Sketch out the classes you will need along with their instance variables and methods. You do not need many classes or multiple layers. My solution has three classes—Location (32 lines), FlowNode (31 lines), and MapMaker (115 lines). Your solution may have more classes, fewer classes, more lines, or fewer lines. Some of the classes may be similar to classes you wrote for previous assignments.
Out of Memory
If you are getting a Java out of memory or heap space error, you may need to run your program with more memory. By default Java limits programs to 64MB of memory. For most projects, this is ok, but for larger data sets, you may need more. To allow Java to run with more memory, use the
-Xmx option. For example, to run with 100MB of memory (which has been sufficient for most people in the class), use:
java -Xmx100m MapMaker
Using 100 or 200MB of memory is OK, but if you are running out of memory with 500MB of RAM in this project, you probably have a bug.
Extra Data Sets
If you would like to test your program on some extra data sets, I have posted a few in
/usr/local/doc/. The filenames and sizes are:
- StroudsCreek.pgm (629KB)
- EastForkEno.pgm (968KB)
- EnoToStroudsCreek.pgm (6.2MB)
- Eno.pgm (14.0MB)
Do not copy these files to your homework directory. You only have a 30MB quota in your home folders and copying all the files will use over 20MB before you create a single image file. Instead, you can use the full path name (e.g.,
/usr/local/doc/StroudsCreek.pgm) as the filename in your program. You may want to save the output to the local partition (e.g.,
/local/rivers.pgm) to limit space as well. Be polite and delete any pgm files you create in the local directory using
rm /local/rivers.pgm. For the larger files, you may want to open images in the gimp and zoom to 100% to see the full resolution image. Both the
Eno and
EnoToStroudsCreek image include as subwatersheds the test data given to you in
terrain.pgm and also
EastForkEno. See if you can process these larger images and find these subwatersheds.
Submitting
Along with your Java source code, you should hand in a README file describing your general approach to solving the problem and any bugs you are aware of. These files will be
imported automatically via handin35.
About the Data
This data set was derived from elevation data in the Sevenmile creek watershed
southwest of Hillsborough, NC.
Google
maps shows the approximate location of the area. The junction of I-40 and
I-85 is visible in the terrain.pgm image in the upper right side. Sevenmile
creek drains into the Eno river at the root of the flow tree you identified.
This is near the area of
Occoneechee Mountain
State Natural Area, though the term "Mountain" is a bit of a stretch for
this region. The Eno River has received increased attention in the area of
Durham, NC as a result of recent conservation efforts. A yearly
Festival for the Eno raises money
for future conservation efforts, plus it is a great chance to hang out with
hippies from the Triangle area while snacking on a jumbo turkey leg. There are
many other applications for processing terrain data in Geographic Information
Systems. If you are interested in hearing more, I'd be happy to talk to you
about this exciting (in my opinion) area.