CS21 Lab 9: Zipcodes
Run update21, to create the cs21/labs/09 directory (and some additional files). Then cd into your cs21/labs/09 directory and create the python programs for lab 9 in this directory
We have a file, /usr/local/doc/zips.txt, which contains zipcode data for most of the United States (don't copy this file to your 09 directory, just use "/usr/local/doc/zips.txt" in your python program). Each line of the file contains nine fields separated by commas:
- ZIP code
- State
- City name
- County name
- Latitude
- Longitude
- Population
- Area in sq. miles
- Population density in people per square mile
19081,PA,Swarthmore,Delaware,39.9,-75.35,10337,2.234,4627.126231
If you want, you can view the file with less: less /usr/local/doc/zips.txt
Your program should prompt the user with a menu of 5 choices:
1: Find a zip code
2: Show state populations
3: Find a city
4: Population density of a county
5: Quit
For option 1 (Find a zip code) you should:
- Prompt the user to enter a zipcode.
- Check to see that they entered 5 digits, otherwise keep prompting for another zipcode until they enter something that could be a valid zip code.
- Use a binary search to find the zip code in your list of zip codes
- Show them the information for that zip code if it's found in the zip code list.
- If the zip code was not in the list, let the user know you could not find the zip code.
- Go back to the main menu.
A sample run showing option 1 is shown here:
$ python zipcodes.py

Welcome to the zipcode program.  Please select one of the
following choices:

1: Find a zip code
2: Show state populations
3: Find a city
4: Population density of a county
5: Quit

Choice? 1
Enter a 5-digit zip code: Swarthmore
Swarthmore is not a valid zip code.  Try again.
Enter a 5-digit zip code: 19081

Swarthmore, PA 19081
Delaware County
Population: 10337
Area: 2.23 square miles
Density: 4627 people per square mile

1: Find a zip code
2: Show state populations
3: Find a city
4: Population density of a county
5: Quit

Choice? 1
Enter a 5-digit zip code: 00000
This zipcode does not exist.

1: Find a zip code
2: Show state populations
3: Find a city
4: Population density of a county
5: Quit

Choice? 5
Goodbye!
For option 2 (Show state populations) you should:
- Prompt the user to enter the two letter abbreviation for a state, allowing for uppercase and lowercase letters.
- If it is not a valid state, keep prompting for another state
until they enter a valid two letter state abbreviation.
- Get the list of valid state abbreviations by accumulating valid states by going through the zip code list once at the start of your program. Look at the state for each zip code, and if it is not in your list of valid states, then append it to your list.
- Once a valid state is entered you should get all the zip codes
for that state and sort them by populations. Print out the top 20
zip codes by population.
- You must write your own sort routine to do this. You can not use Python's built-in sorting methods.
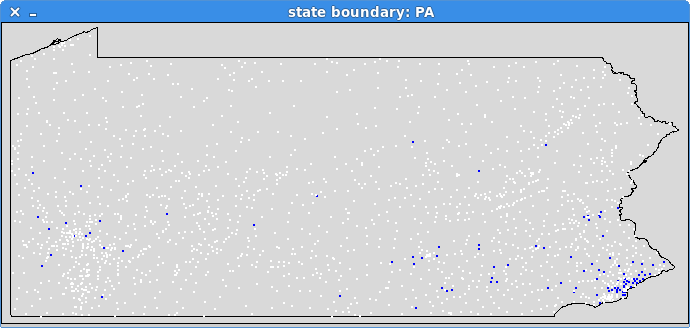
- Use our graphic library to display all the zip codes in the
state. Show the top 100 zip codes by population in
blue and the other zip codes in white.
- Show the image of the state and zip codes until the user clicks on the window. Then close the window and continue the program.
- See the tips section on how to use the graphics library for showing states.
$ python zipcodes.py

Welcome to the zipcode program.  Please select one of the
following choices:

1: Find a zip code
2: Show state populations
3: Find a city
4: Population density of a county
5: Quit

Choice? 2
Enter a state: Penn
Penn is not a valid state abbreviation.  Try again.
Enter a state: pa
The 20 zipcodes with the higest population in PA is:

19120 Philadelphia       68104
19124 Philadelphia       66691
19143 Philadelphia       64849
19111 Philadelphia       63090
17603 Lancaster          61973
19134 Philadelphia       60675
15601 Greensburg         59483
19020 Bensalem           55493
19446 Lansdale           55138
19149 Philadelphia       55006
19140 Philadelphia       54133
17602 Lancaster          52452
19382 West Chester       52388
19320 Coatesville        52342
19104 Philadelphia       51808
19067 Morrisville        51334
17331 Hanover            50292
17601 Lancaster          49779
18102 Allentown          49779
19148 Philadelphia       49732

1: Find a zip code
2: Show state populations
3: Find a city
4: Population density of a county
5: Quit

Choice? 5
Goodbye!
For option 3 (Find a city) you should:
- Prompt the user to enter a city (or the start of a city).
- You should print out the city, state, zip code, and population
of all cities that start with the city name the user typed in,
sorted by population from largest to smallest.
- Ignore case when searching for the city
- The string method startswith() may be helpful.
- If nothing matches, let the user know you couldn't find any cities.
$ python zipcodes.py
Welcome to the zipcode program.  Please select one of the
following choices:

1: Find a zip code
2: Show state populations
3: Find a city
4: Population density of a county
5: Quit

Choice? 3
Enter a city to lookup: london

Here are all the cities I can find that start with that...
London, OH 43140 Population: 24066
Londonderry, NH 03053 Population: 23957
London, KY 40741 Population: 21875
London, KY 40744 Population: 18334
London, AR 72847 Population: 2850
Londonderry, OH 45647 Population: 2484
Londonderry, VT 05148 Population: 1140
London Mills, IL 61544 Population: 713
London, TX 76854 Population: 401
London, KY 40743 Population: 229
London, WV 25126 Population: 58

1: Find a zip code
2: Show state populations
3: Find a city
4: Population density of a county
5: Quit

Choice? 3
Enter a city to lookup: ponies

Sorry... I can't find anything for that city name...

1: Find a zip code
2: Show state populations
3: Find a city
4: Population density of a county
5: Quit

Choice? 5
Goodbye!
For option 4 (Population density of a county) you should:
- Ask the user for a valid state abbreviation. Keep prompting till a valid state is entered.
- Then ask for a county in that state. You should ignore case, but look for an exact match of the county.
- Print out the city, zip code, and population density for the zip codes in that county, sorted from greatest population density to least population density.
- If the county does not exist, let the user know you could not find that county for that state.
$ python zipcodes.py
Welcome to the zipcode program.  Please select one of the
following choices:

1: Find a zip code
2: Show state populations
3: Find a city
4: Population density of a county
5: Quit

Choice? 4
Enter a state: pa
Enter a county in PA: Delaware

Here are the cities in Delaware PA, sorted by population density:
Upper Darby          19082 Pop Density:  15829 people per square mile
Darby                19023 Pop Density:  11099 people per square mile
Prospect Park        19076 Pop Density:   8758 people per square mile
Clifton Heights      19018 Pop Density:   8636 people per square mile
Drexel Hill          19026 Pop Density:   8489 people per square mile
Glenolden            19036 Pop Density:   8464 people per square mile
Yeadon               19050 Pop Density:   7620 people per square mile
Norwood              19074 Pop Density:   7580 people per square mile
Folsom               19033 Pop Density:   7051 people per square mile
Holmes               19043 Pop Density:   6727 people per square mile
Morton               19070 Pop Density:   6713 people per square mile
Folcroft             19032 Pop Density:   6502 people per square mile
Havertown            19083 Pop Density:   6456 people per square mile
Chester              19013 Pop Density:   6138 people per square mile
Woodlyn              19094 Pop Density:   5494 people per square mile
Ridley Park          19078 Pop Density:   5473 people per square mile
Brookhaven           19015 Pop Density:   5072 people per square mile
Sharon Hill          19079 Pop Density:   4964 people per square mile
Swarthmore           19081 Pop Density:   4627 people per square mile
Broomall             19008 Pop Density:   3132 people per square mile
Springfield          19064 Pop Density:   3072 people per square mile
Wallingford          19086 Pop Density:   2964 people per square mile
Marcus Hook          19061 Pop Density:   2850 people per square mile
Eddystone            19022 Pop Density:   2788 people per square mile
Bryn Mawr            19010 Pop Density:   2504 people per square mile
Aston                19014 Pop Density:   2357 people per square mile
Haverford            19041 Pop Density:   1892 people per square mile
Cheyney University   19319 Pop Density:   1785 people per square mile
Essington            19029 Pop Density:   1718 people per square mile
Media                19063 Pop Density:   1547 people per square mile
Villanova            19085 Pop Density:   1478 people per square mile
Garnet Valley        19060 Pop Density:   1449 people per square mile
Thornton             19373 Pop Density:   1031 people per square mile
Glen Mills           19342 Pop Density:    928 people per square mile
Newtown Square       19073 Pop Density:    886 people per square mile
Chadds Ford          19317 Pop Density:    452 people per square mile
Chester Heights      19017 Pop Density:    391 people per square mile
Philadelphia         19113 Pop Density:     35 people per square mile

1: Find a zip code
2: Show state populations
3: Find a city
4: Population density of a county
5: Quit

Choice? 4
Enter a state: NJ
Enter a county in NJ: NotACounty

I couldn't find NotACounty county in NJ.

1: Find a zip code
2: Show state populations
3: Find a city
4: Population density of a county
5: Quit

Choice? 5
Goodbye!
For option 5 (Quit) you should:
- Print out a goodbye message.
- Exit the program.
- When you read the data from the zips.txtfile, store the
data in a python list, where each item in the list is itself a list of
zipcode data for one zipcode: [zipcode, state, city, county,
latitude, longitude, population, area, popDensity].
Your "list of lists" should look like this:
[[zipcode data from line 1], [zipcode data from line 2],
..., [zipcode data from last line]]
- Validate all menu selections. If they user doesn't enter a valid number (1-5), let the user know it wasn't a valid selection and prompt them again for a new menu item.
- The file lists all zip codes in sorted order, so it is not necessary to modify the order of items when you read the data in.
- Your searches must be as efficient as possible. That is, you should use binary search or linear search where appropriate.
- Since our data is stored in a python list of lists, you will need to modify one of our sort functions from class to handle this data. You should not use the built-in python sort or sorted functions.
- You'll be doing several sorts for this lab. The easiest way to do this is have one generic sorting function that takes two parameters. The first is the full list of zip codes, and the second is an index telling you what item in that list you should be sorting on. You'll do the sorting based on the values of that index. For example if you wanted to do a sort on population density, the index would be 8 in this case, as that is the index for the population density field.
- It is best to store the zipcodes as strings. Some zipcodes begin with a zero, and python removes leading zeros from integers.
- Some of the data (e.g., latitude, longitude, population, etc.) will need to be converted from strings to floats or integers.
- Population density is stored as a float, but it is nicer to print it out as a integer when displaying. The string format of "%.0f" will do this for you.
- We encourage you to finish the text part of this program before you add the graphics. This makes testing easier and faster. Once you have the text portion working, then add the graphics.
- To plot the state boundaries we have written some functions to create
the graphics window already scaled to appropriate dimensions for the given
state. You should be able to use the code below to create the graphics
window with the state boundary already drawn. Your program must then draw
points for all zipcodes (using the latitude as the y coordinate and the
longitude as the x coordinate).
from boundaries import *

state = "VA"
win = getStateGraphWin(state)
if win != None:
  # plot all zipcodes for this state here...use lat/long for each zipcode
  win.getMouse()
  win.close()
The zipcode data file we have provided you is by no means complete. Some ZIP
codes were missing or did not have lat/long data and were removed. For
some cities, we did not have population data, so we set the population
arbitrarily to 0. If your favorite US city or hometown in the US is
missing and you know all the info (ZIP, city name, county name, state,
lat, long, and population), let us know and we will be happy to add a
few cities, but we are not trying to maintain a comprehensive list.
Once you are satisfied with your program, hand it in by typing handin21 in a terminal window.