Using the Zelle Graphics Library
Overview
The package graphics.py is a simple object oriented graphics library designed to make it very easy for novice programmers to experiment with computer graphics in an object oriented fashion. It was written by John Zelle for use with the book "Python Programming: An Introduction to Computer Science" (Franklin, Beedle & Associates).
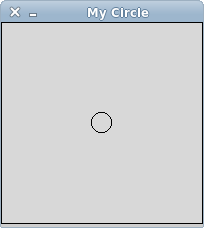
There are two kinds of objects in the library. The GraphWin class implements a window where drawing can be done, and various GraphicsObjects are provided that can be drawn into a GraphWin. As a simple example, here is a complete program to draw a circle of radius 10 centered in a 200x200 window:
from graphics import *


def main():

    win = GraphWin("My Circle", 200, 200)

    c = Circle(Point(100,100), 10)

    c.draw(win)

    win.getMouse() # pause for click in window

    win.close()


main()
GraphWin Objects
AGraphWin represents a window on the screen where graphical images may be drawn. A program may define any number of GraphWins. A GraphWin understands the following methods:
GraphWin(title, width, height)- Constructs a new graphics window for drawing on the screen. The parameters are optional, the default title is "Graphics Window", and the default size is 200 x 200.
plot(x, y, color)- Draws the pixel at
(x,y)in the window. Color is optional, black is the default. plotPixel(x, y, Color)- Draws the pixel at the position
(x,y)ignoring any coordinate transformations set up bysetCoords. setBackground(color)- Sets the window background to the given color. The initial background is gray. See below for information on specifying colors.
close()- Closes the on-screen window.
getMouse()- Pauses for the user to click a mouse in the window and returns where the mouse was clicked as a
Pointobject. checkMouse()- Similar to
getMouse, but does not pause for a user click. Returns the latestPointwhere the mouse was clicked orNoneif the window as not been clicked since the previous call tocheckMouseorgetMouse. This is particularly useful for controlling simple animation loops. getWidth()- Get the width of the window.
getHeight()- Get the height of the window.
setCoords(xll, yll, xur, yur)- Sets the coordinate system of the window. The lower-left corner is
(xll, yll)and the upper-right corner is(xur, yur). All subsequent drawing will be done with respect to the altered coordinate system (except forplotPixel).
Graphics Objects
The module provides the following classes of drawable objects:Point, Line, Circle, Oval, Rectangle, Polygon, Text. All objects are initially created unfilled with a black outline. All graphics objects support the following generic set of methods:
setFill(color)- Sets the interior of the object to the given color.
setOutline(color)- Sets the outline of the object to the given color.
setWidth(pixels)- Sets the width of the outline of the object to this many pixels. (Does not work for
Point.) draw(GraphWin)- Draws the object into the given
GraphWin. undraw()- Undraws the object from a graphics window. This produces an error if the object is not currently drawn.
move(dx,dy)- Moves the object
dxunits in thexdirection anddyunits in theydirection. If the object is currently drawn, the image is adjusted to the new position. clone()- Returns a duplicate of the object. Clones are always created in an undrawn state. Other than that, they are identical to the cloned object.
Point Methods
Point(x,y)- Constructs a point having the given coordinates.
getX()- Returns the
xcoordinate of a point. getY()- Returns the
ycoordinate of a point.
Line Methods
Line(point1, point2)- Constructs a line segment from
point1topoint2. setArrow(string)- Sets the
arrowheadstatus of a line. Arrows may be drawn at either the first point, the last point, or both. Possible values ofstringarefirst,last,both, andnone. The default setting isnone. getCenter()- Returns a clone of the midpoint of the line segment.
getP1(),getP2()- Returns a clone of the corresponding endpoint of the segment.
Circle Methods
Circle(centerPoint, radius)- Constructs a circle with given center point and radius.
getCenter()- Returns a clone of the center point of the circle.
getRadius()- Returns the radius of the circle.
getP1(),getP2()- Returns a clone of the corresponding corner of the circle's bounding box. These are opposite corner points of a square that circumscribes the circle.
Rectangle Methods
Rectangle(point1, point2)- Constructs a rectangle having opposite corners at
point1andpoint2. getCenter()- Returns a clone of the center point of the rectangle.
getP1(),getP2()- Returns a clone of corner points originally used to construct the rectangle.
Oval Methods
Oval(point1, point2)- Constructs an oval in the bounding box determined by
point1andpoint2. getCenter()- Returns a clone of the point at the center of the oval.
getP1(),getP2()- Returns a clone of the corresponding point used to construct the oval.
Polygon Methods
Polygon(point1, point2, point3, ...)- Constructs a polygon having the given points as vertices. Also accepts a single parameter that is a list of the vertices.
getPoints()- Returns a list containing clones of the points used to construct the polygon.
Text Methods
Text(anchorPoint, string)- Constructs a text object that displays the given
stringcentered atanchorPoint. The text is displayed horizontally. setText(string)- Sets the text of the object to
string. getText()- Returns the current
string. getAnchor()- Returns a clone of the anchor point.
setFace(family)- Changes the font face to the given
family. Possible values arehelvetica,courier,times roman, andarial. setSize(point)- Changes the font size to the given
pointsize. Sizes from 5 to 36 points are legal. setStyle(style)- Changes font to the given
style. Possible values are:normal,bold,italic, andbold italic. setTextColor(color)- Sets the color of the text to
color. Note:setFillhas the same effect.
Entry Objects
Objects of Entry are displayed as text entry boxes that can be edited by the user of the program. Entry objects support the generic graphics methods move(), draw(graphwin), undraw(), setFill(color), and clone(). The Entry specific methods are given below.
Entry(centerPoint, width)- Constructs an
Entryhaving the givencenterPointandwidth. Thewidthis specified in number of characters of text that can be displayed. getAnchor()- Returns a clone of the point where the entry box is centered.
getText()- Returns the string of text that is currently in the entry box.
setText(string)- Sets the text in the entry box to the given
string. Changes the font face to the given family. Possible values arehelvetica,courier,times roman, andarial. setSize(point)- Changes the font size to the given
pointsize. Sizes from 5 to 36 points are legal. setStyle(style)- Changes font to the given
style. Possible values are:normal,bold,italic, andbold italic. setTextColor(color)- Sets the color of the text to
color.
Displaying Images
The graphics module also provides minimal support for displaying and manipulating images in a GraphWin. Most platforms will support at least PPM and GIF images. Display is done with an Image object. Images support the generic methods move(dx,dy), draw(graphwin), undraw(), and clone(). Image-specific methods are given below.
Image(anchorPoint, filename)- Constructs an
Imagefrom contents of the givenfilenamecentered at the givenanchorPoint. Can also be called withwidthandheightparameters instead offilename. In this case, a blank (transparent) image is created of the givenwidthandheight. getAnchor()- Returns a clone of the point where the image is centered.
getWidth()- Returns the width of the image.
getHeight()- Returns the height of the image.
getPixel(x, y)- Returns a list
[red, green, blue]of the RGB values of the pixel at position(x,y). Each value is a number in the range 0-255 indicating the intensity of the corresponding RGB color. These numbers can be turned into a color string using thecolor_rgbfunction (see next section).Note that pixel position is relative to the image itself, not the window where the image may be drawn. The upper-left corner of the image is always pixel
(0,0). setPixel(x, y, color)- Sets the pixel at position
(x,y)to the givencolor. Note: this is a slow operation. save(filename)- Saves the image to the file
filename. The type of the resulting file (e.g., GIF or PPM) is determined by the extension on thefilename. For example,img.save("myPic.ppm")savesimgas a PPM file.
Generating Colors
Colors are indicated by strings. Most normal colors such asred, purple, green, cyan, etc. should be available. Many colors come in various shades, such as red1,red2,red3,and red4, which are increasingly darker shades of red.
To see the full set of colors available to you:
$ python
>>> from colorPicker import *
>>> colorPicker()
The graphics module also provides a function for mixing your own colors numerically. The function color_rgb(red, green, blue) will return a string representing a color that is a mixture of the intensities of red, green and blue specified. These should be ints in the range 0-255. Thus color_rgb(255, 0, 0) is a bright red, while color_rgb(130, 0, 130) is a medium magenta.