CS 21: Algorithmic Problem Solving
HW #3: Object-Oriented Programming and Graphics
Due 11:59pm Tuesday, February 13As with homework #2, this homework will require you to write programs in Python. You should save your programs in your cs21/homework/3 directory. A skeleton version of each program you will write will appear in your cs21/homework/3 when you run update21. The program handin21 will only submit files in the cs21/homework/3 directory.
Your programs are graded on both correctness and style. Please review the comments regarding programming style on the main page
Some of the problems will have optional components that allow you
to further practice your skills in python. Optional portions will not
be graded, but may be interesting for those wanting some extra
challenges.
For this assignment, you will be using a class called Stock which will give you access to historical stock data for any stock that you are interested in. In order to be sure that this assignment is accessible to everyone, let's begin with a very simplistic explanation of investing in stocks.
To begin, we'll go to Yahoo's finance page and find the historical stock data for Microsoft (MSFT) from 12/31/2006 back to 1/1/2006. You can go directly there by clicking on this link. On the historical stock data page, you'll see a table that begins like this:
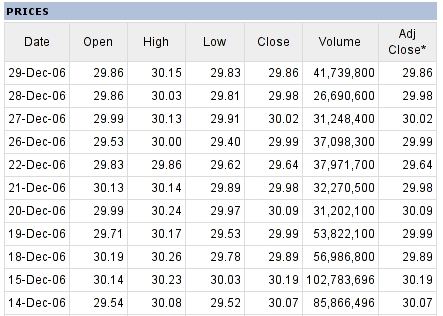
Focus your attention on the first and last columns. The first column is the date and the last column is the price of 1 share of stock at the end of that day. For example, at the end of the day on Dec 29, 1 share of stock was worth $29.86. For the purposes of this assignment, these are the only two columns that matter.
If you were to have purchased 1 share of Microsoft stock on Dec 14, 2006, you would have paid $30.07. If you had decided to sell that stock on Dec 29, 2006, you would have only received $29.86. In other words, you would have lost $0.21.
If you go all the way to end of the data, until you get to Jan 3, you'll find that on Jan 3, 1 share of Microsoft stock was worth $26.46. If you had purchased 1 share on Jan 3 (for $26.46) and sold that share on Dec 29 (for $29.86), you would have made $3.42.
If, back on Jan 3, you had $100 and you wanted to buy Microsoft stock at $26.46 per share, you could afford to buy $100 / ($26.46 per share) = 3.7793 shares. At the end of the year on Dec 29, your $100 investment would be worth 3.7793 shares * ($29.86 per share) = $112.85.
Stocks are represented in the stock market not by the name of the company, but by a special alphabetic symbol. For example, Microsoft is represented by the symbol MSFT. Some big technology companies and their symbols are listed below. You can also look up the stock symbol for any other company you might be interested in.
| Company | Symbol |
|---|---|
| Microsoft | MSFT |
| Dell | DELL |
| Apple | AAPL |
| Cisco | CSCO |
| IBM | IBM |
| Intel | INTC |
| AMD | AMD |
| Yahoo! | YHOO |
| GOOG | |
| Ebay | EBAY |
| Amazon | AMZN |
| Netflix | NFLX |
| Western Digital | WDC |
| Nokia | NOK |
| Motorola | MOT |
Note: The prices of stocks change only on days that the
stock market is open. The stock market is closed on weekends and
holidays (such as Labor Day) and the historical stock price data
does not include days when the stock market is closed. Since Jan 3
was the first day the stock market was open in 2006, and Dec 29 was
the final day the stock market was open, the historical data for
2006 runs from Jan 3 until Dec 29.
    >>> import Stock
    >>> help(Stock)
Here is some sample code which illustrates the use of the Stock class:
    >>> from Stock import *
    >>> stock = Stock('MSFT')
    >>> stock.symbol()
    'MSFT'
    >>> pricelist = stock.prices()
    >>> print "$%0.2f" % (pricelist[0])   # This is the price on Jan 3
    $26.46
    >>> datelist = stock.dates()
    >>> print datelist[0]
    3-Jan-06
    >>> print datelist[100]
    26-May-06
    >>> print "$%0.2f" % (pricelist[100])   # This is the price on May 26
    $23.55
Write a program which shows the results of buying a particular stock at the start of 2006 (actually Jan 3, 2006 -- see the note above) and selling that stock at the end of 2006 (actually Dec 29, 2006).
Your program should prompt the user for a stock symbol and an amount to invest. From this information, you should compute the value of their investment at the end of they year. Save your file as basic.py in your cs21/homework/3 directory.
A sample run is shown below for an investment in Netflix:
  Enter a stock to invest in: NFLX
  Enter the amount to invest on 3-Jan-06: 1000

  On 3-Jan-06, NFLX was worth $26.05 per share.
  With $1000.00, you were able to buy 38.3877 shares.

  On 29-Dec-06, NFLX was worth $25.86 per share.
  At that price, your 38.3877 shares were worth $992.71.
Unfortunately, back in real life, we cannot pick the very best day to buy a stock (or, for that matter, when to sell). For this reason, some people invest using a strategy called "Dollar Cost Averaging". In this investment strategy, you buy a smaller amount stock at fixed intervals. Some of these investments may be at prices that are higher than if you invested everything at the start of the year and some of these investments may also be at prices that are lower than the price at the start of the year.
In this question, you will write a new program (saved as dca.py) which allows you to experiment with dollar cost averaging. You will prompt the user for the stock symbol to invest in, the number of times per year that they would like to invest, and the amount they would like to invest each time.
Here are two sample runs comparing what would happen if you invested all of your money at the start of the year versus investing 1/5 of the money at 5 regular intervals:
     Enter a stock to invest in: NFLX
     Enter the number of times per year to invest: 1
     Enter the incremental investment amount: 1000
                     Stock        New      Total      Total
        Date         Price     Shares     Shares      Value
       3-Jan-06      26.05    38.3877    38.3877    1000.00
      29-Dec-06      25.86               38.3877     992.71


     Enter a stock to invest in: NFLX
     Enter the number of times per year to invest: 5
     Enter the incremental investment amount: 200
                     Stock        New      Total      Total
        Date         Price     Shares     Shares      Value
     2006-01-03      26.05     7.6775     7.6775     200.00
     2006-03-16      25.47     7.8524    15.5299     395.55
     2006-05-26      28.83     6.9372    22.4671     647.73
     2006-08-08      20.30     9.8522    32.3194     656.08
     2006-10-18      22.39     8.9326    41.2519     923.63
     2006-12-29      25.86               41.2519    1066.77
Note: If a user says that they would like to invest 1 time
per year, their investment should be made at the start of the year.
If a user says that they would like to invest 2 times per year, the
first investment should be made at the start of the year and the
second investment should be made midway through the year (in this
case, approximately July 3). If they would like to invest 3 times
per year, the investment dates would be (approximately) Jan 3, May
3, and Aug 31. And so on.
You may wish to consult the textbook's graphics reference page. In particular, you will need to know how to create a graphics window, set the coordinate system (using the setCoords method in the GraphWin class), and create points and lines.
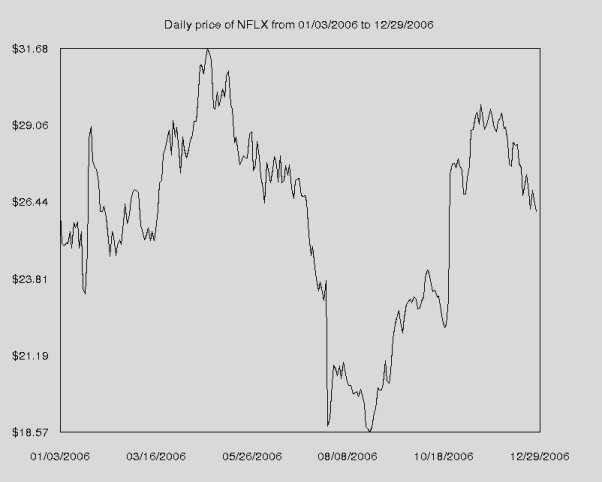
You should prompt the user to enter a stock symbol and then draw the appropriate graph. For example:
Enter a stock symbol: NFLX
Extension to Q. 1: Oracle investing
If you were an Oracle, you would know ahead of time which day was the best day to buy a particular stock, and which day was the best day to sell a particular stock. This way, you wouldn't have to worry about dollar cost averaging. Of course, you'd be an Oracle, so you probably wouldn't have money troubles.Ask the user to input a stock symbol and an amount to invest. Tell the user when the optimal time to buy was and how much their investment would have been worth if they then sold it on Dec 29. Also, do the reverse: assuming they bought on Jan 3, tell the user when the optimal time to sell would have been and how much their investment would have been worth.
Save this as a separate program called oracle.py.
Enter a stock to invest in: NFLX
Enter the amount to invest: 1000
Buying Jan 3, selling at the optimal time:
      Date      Price     Shares      Value
  3-Jan-06      26.05    38.3877    1000.00
 25-Apr-06      31.68    38.3877    1216.12
Buying at the optimal time, selling on Dec 29:
      Date      Price     Shares      Value
 24-Aug-06      18.57    53.8503    1000.00
 29-Dec-06      25.86    53.8503    1392.57
Hint: You might want to investigate the functions max and min (try help(max) and help(min)). Both functions can be very helpful in solving this problem.
Note: You can answer this using only the information you have learned in class to date. This means that even if you know about if statements, you should not use them!
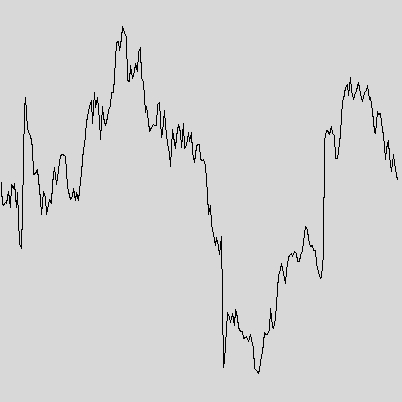
Extension to Q. 3: Graph with a key
Add an informative key to your graph, such as: