CS21 Lab 11: population genetics
Run update21, if you haven't already, to create the cs21/labs/11 directory. Then cd into your cs21/labs/11 directory and create the python program for lab 11 in this directory (handin21 looks for your lab 11 assignments in your cs21/labs/11 directory).
$ update21
$ cd cs21/labs/11
In this lab we will explore the topic of population genetics and consider how the proportion of genotypes within a population changes over time. A population is a group of organisms of the same species that can interbreed. In our simplified experiment, we will use organisms that contain a single gene (a 2-character string). The alleles for this gene are 'T' and 't'. Each organism will get one allele from each parent. Therefore each organism is represented as a string of length two. Organisms with the genotype 'TT', 'Tt', or 'tT' will be tall, and organisms with the genotype 'tt' will be short.
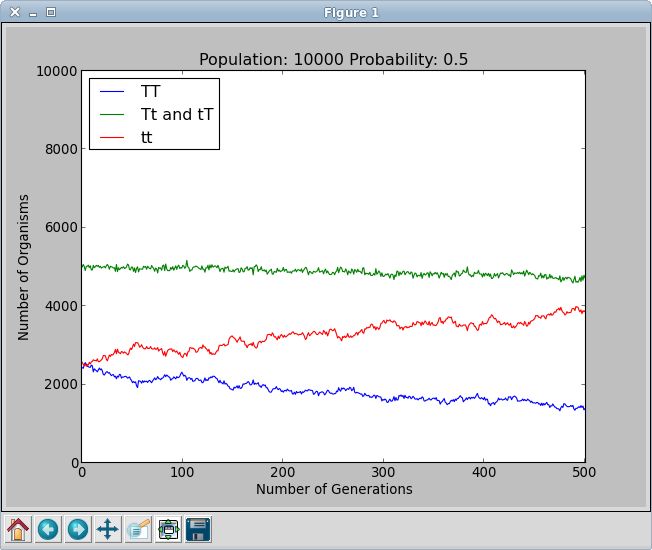
According to the Hardy-Weinberg principle, regardless of initial proportion of the 'T' allele in the starting population, you should see that the percentages of each genotype remain fairly constant over time. In other words, if about 25% of the organisms in the population are tall, then after 200 generations, the population should still consist of about 25% tall organisms. Our simulation will test this prediction.
You job in this lab is to write a Population() class that allows the user to create and evolve different populations (different size and different mix of tall/short organisms). After creating and testing your Population() class, you will then write a short application program to use the class and run some population simulations. Here is a quick preview of the application:
$ python pop-sim.py

Population Genetics Simulation...

      population size: 2000
   allele probability: 0.5
number of generations: 200

Size: 2000  --  Prob: 0.50  --  Gen#: 0
 Dominant:   472 (23.6%)
    Mixed:  1028 (51.4%)
Recessive:   500 (25.0%)

Size: 2000  --  Prob: 0.50  --  Gen#: 200
 Dominant:   466 (23.3%)
    Mixed:   993 (49.6%)
Recessive:   541 (27.1%)
A Population object represents a simplified population of one-gene organisms. You should define your class (in pop.py) such that each population maintains the following data (also called instance variables):
- a size: the number of organisms in the population (an integer)
- the population: a list of 2-character strings ("TT", "Tt", "tT", or "tt"), one for each organism
- a probability: a float between 0 and 1 (see below), the probability of having one allele vs the other
- a generation number (an int): how many reproduction generations the population has gone through
- A constructor
that initializes a Population object. The prototype for
your constructor is:
def __init__(self, size, probability):
where the parameters specify the size of the population and the probability of having the allele 'T' vs 't', represented as a floating point value between 0 and 1. - An __str__ method that returns a string representation of the Population object. Your method should return a string containing all of the data in the object in a readable format. See the example below.
- A countGenotypes() method that counts and returns the number of each genotype in the population: [dominant, mixed, recessive] (where dominant is "TT", mixed is "Tt" and "tT", and recessive is "tt")
- A oneGeneration() method that simulates one generation of reproduction (described below).
Below are some examples of using the Population() class as well as some details on how each method should work.
>>> from pop import *
>>> p = Population(10, 0.5)
>>> print p
Size: 10  --  Prob: 0.50  --  Gen#: 0
['Tt', 'tt', 'Tt', 'tT', 'tt', 'tT', 'tT', 'Tt', 'TT', 'Tt']
>>> p.countGenotypes()
[1, 7, 2]
>>> p.oneGeneration()
>>> print p
Size: 10  --  Prob: 0.50  --  Gen#: 1
['tT', 'TT', 'TT', 'Tt', 'TT', 'Tt', 'Tt', 'tT', 'Tt', 'tT']
>>> p.countGenotypes()
[3, 7, 0]
Notice the Population() constructor above creates a population of 10 organisms, each with two alleles, and the probability of getting a "T" or a "t" is 50%. Calling Population(10, 0.75) would generate a list of ten organisms where approximately 75% of the alleles are 'T' and 25% are 't'.
The oneGeneration() method should simulate one generation of reproduction. This function changes the current population of organisms into the children of the given population. The new population should be the same size as the given population.
To create a child, randomly select two parents from the original population. (Note that for the purposes of this simulation we are ignoring gender; any two organisms from the population are able to mate.) Then randomly select an allele from the first parent and randomly select an allele from the second parent. Combine these two alleles to make a child. For example, suppose that you randomly selected parent1 as 'TT' and parent2 as 'tt'. You would randomly select an allele from parent1: 'T' and randomly select an allele from parent2: 't' and form their child 'Tt'. Accumulate the children into a new population using the list append method. Once the new population is made, change the current population to be the new population.
The countGenotypes() method just counts how many of each genotype are in the current population: dominant ("TT"), mixed ("Tt" and "tT"), and recessive ("tt"). This method should return a list of the counts.
Test your class before moving on to the next part!
Write a program called pop-sim.py that uses the Population() class and allows the user to create a population and simulate many generations of reproduction. Your program should ask for the following data:
- size: number of organisms in the population
- probability: the probability of having one allele vs the other
- num generations: the number of generations to simulate
Your program should print out the initial and final genotype distributions.
Try creating an initial population of size 1000, using a probability of 0.5 for the
'T' allele, and running the simulation for 200 generations.
You should see about 25% dominant, 50% mixed, and 25% recessive,
and the proportion of each genotype should be about the same at the end
of the simulation.
Currently your program only reports the initial and final distribution of genotypes in the population. It would be more interesting to graph the distribution across all the generations.
Modify your program to accumulate three lists that maintain the counts of the genotypes (recessive, dominant, and mixed) for each generation. After simulating all of the generations, these three lists contain the history of counts for each kind of genotype in the population.
Just before your program ends, call the following function to plot the genotype counts versus time:
from pylab import *

def populationGraph(dominant, mixed, recessive):
  """use pylab to plot genotype counts vs time"""
  numOrganisms = recessive[0] + dominant[0] + mixed[0]
  plot(range(len(dominant)), dominant, label="TT")
  plot(range(len(mixed)), mixed, label="Tt and tT")
  plot(range(len(recessive)), recessive, label="tt")
  legend(loc='upper left')
  axis([0,len(recessive),0,numOrganisms])
  xlabel('Number of Generations')
  ylabel('Number of Organisms')
  show()
Do the percentages of each genotype remain fairly constant over time as predicted by the Hardy Weinberg principle?
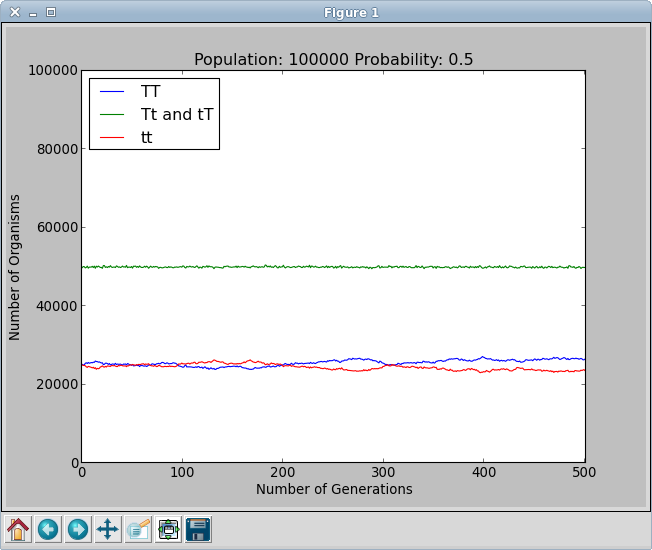
One of the
assumptions for the equilibrium to hold is that the population size
is infinitely large. If the population is too small, the population
may suffer genetic drift.
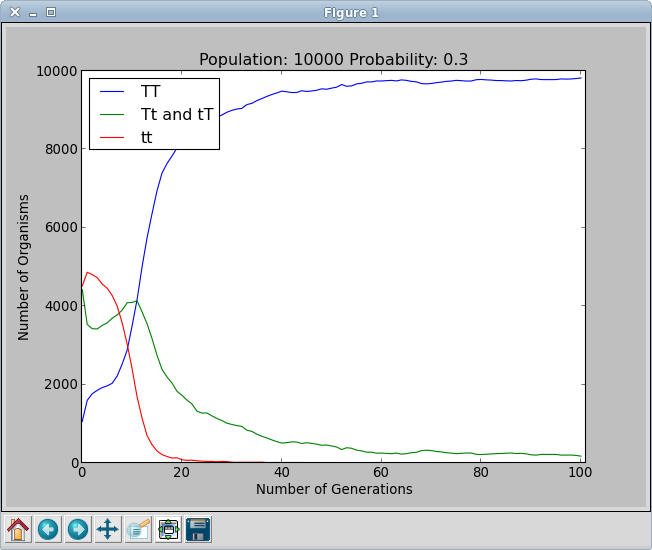
According to the Hardy-Weinberg principle, a population will remain in equilibrium only under certain conditions such as when mating is completely random. Let's explore how the proportion of genotypes in the population will change if we add preferential mating to our simulation.
Modify your program so that it now asks the user whether or not to use preferential mating.
$ python pop-sim.py

Population Genetics Simulation...

      population size: 2000
   allele probability: 0.5
number of generations: 200
use pref mating (y/n)? y
Modify the oneGeneration() method so that it takes an additional parameter. This parameter will be a boolean representing whether preferential mating should occur. When it is False reproduction will work just as before. When it is True, tall organisms will prefer tall mates and short organisms will prefer short mates. Recall that if an organism has at least one 'T' allele it will be tall, otherwise it will be short.
You should implement preferential mating as follows. Randomly select two parents from the population. If they are both tall or both short, then immediately create a child. If they are different heights, then randomly re-select the second parent. Regardless of the new second parent's height, create a child.
Does the population remain in equilibrium once this feature is
added?
This lab was inspired by an assignment given at Harvey Mudd College
for a team-taught Biology and Computer Science course given by
professors Zachary Dodds, Ran Libeskind-Hadas, Eliot Bush, and Steve
Adolph.
Once you are satisfied with your program, hand it in by typing handin21 in a terminal window.