CS21B Lab 6: Population genetics
As always...run update21, if you haven't already, to create the
cs21/labs/06 directory. Then cd into your cs21/labs/06
directory and create the python program for this lab in that directory.
The program handin21 will only submit
files in this directory.
Write a program called yahtzee.py to simulate rolling five 6-sided dice. Your program should roll them over and over, until the result is 5-of-a-kind (all five dice end up the same, like all fours or all sixes -- a Yahtzee). Your program should also keep track of how many rolls it took to get the 5-of-a-kind roll. For example:
$ python yahtzee.py
Got 5-of-a-kind: [2, 2, 2, 2, 2] -- took 1183 tries

$ python yahtzee.py
Got 5-of-a-kind: [3, 3, 3, 3, 3] -- took 1407 tries
In the rest of this lab we will explore the topic of population genetics and consider how the proportion of genotypes within a population changes over time. A population is a group of organisms of the same species that can interbreed. In our simplified experiment, we will use organisms that contain a single gene. The alleles for this gene are 'T' and 't'. Each organism will get one allele from each parent. Therefore each organism is represented as a string of length two. Organisms with the genotype 'TT', 'Tt', or 'tT' will be tall, and organisms with the genotype 'tt' will be short.
According to the Hardy-Weinberg principle, regardless of initial proportion of the 'T' allele in the starting population, you should see that the percentages of each genotype remain fairly constant over time. In other words, if about 25% of the organisms in the population are tall, then after 200 generations, the population should still consist of about 25% tall organisms. Our simulation will test this prediction.
A skeleton version of the program population.py will appear in your cs21/lab/06/ directory when you run update21 in a terminal window. Add the functions described below to this population.py file. For each of the required functions be sure to include comments at the top describing the inputs and return value, like this:
def initPop(size, prob):
  """
  initialize the population, based on probability having certain allele

  size: total number of organisms in the population
  prob: probability of having the allele 'T' vs 't',
        represented as a floating point value between 0 and 1

  returns list of organisms represented as strings
  (ex: ['TT', 'tt', 'Tt', 'Tt'])
  """
Write a function called initializePopulation that takes as parameters:
- popSize: The size of the population represented as an integer.
- p: The probability of having the allele 'T' vs 't' represented as a floating point value between 0 and 1.
This function returns a list of organisms represented as strings.
Use the list method append to accumulate the population into a list.
Use the random library function random() to determine whether each allele should be a 'T' or a 't' based on a given probability p:
if random() < p:
   allele = 'T'
else:
   allele = 't'
Note: The random() function returns a random floating point number from 0 up to but not including 1.
For example, calling initializePopulation(10, 0.5) will generate a list of ten organisms where approximately 50% of the alleles are 'T' and 50% are 't'.
['TT', 'tt', 'Tt', 'Tt', 'Tt', 'tt', 'tt', 'TT', 'TT', 'Tt']
Calling initializePopulation(10, 0.75) will generate a list of ten organisms where approximately 75% of the alleles are 'T' and 25% are 't'.
['tT', 'TT', 'TT', 'tT', 'tT', 'TT', 'TT', 'Tt', 'Tt', 'TT']
Calling initializePopulation(10, 0.25) will generate a list of ten organisms where approximately 25% of the alleles are 'T' and 75% are 't'.
['tt', 'tt', 'tt', 'tt', 'Tt', 'TT', 'tt', 'tt', 'tt', 'tt']
What should happen if the probability given to this function were 0 or 1? Test all of these cases in main before moving on to the next part.
Note that because the process of initializing a population is
random, it is unlikely that you will get the exact same results when
you test your code.
Write a function called countGenotypes that takes as a parameter:
- population: a list of organisms represented as strings
This function does not return anything.
The function should print the percentages of the dominant ('TT'), mixed ('Tt' or 'tT'), and recessive ('tt') genotypes in the given population. Use the list method count to help you compute the percentages. For instance, try the following:
ls = ['a', 'b', 'a', 'd', 'a', 'c']
ls.count('a')
For example, given the following population of 10 organisms:
['Tt', 'TT', 'tt', 'TT', 'tt', 'TT', 'Tt', 'tT', 'tt', 'tT']
3 out of 10 are dominant, 4 out of 10 are mixed, and 3 out of 10 are recessive. Therefore, countGenotypes function should print:
TT: 0.300 Tt and tT: 0.400 tt: 0.300To create nicely aligned output, you should use string formatting. For example, you can force python to print 3 significant digits using the following statement:
print "TT: %.3f Tt and tT: %.3f tt: %.3f" % (TT_freq, Tt_freq, tt_freq)which tells python to substitute the value of TT_freq for the first % symbol. The f indicates it should be treated as a float value and the .3 says to use three digits after the decimal point. Tt_freq gets placed with the second % symbol, and so on.
Test your function in main before moving on to the next part.
Write a function called oneGeneration that takes as a parameter:
- population: a list of organisms represented as strings
To create a child, randomly select two parents from the population. (Note that for the purposes of this simulation we are ignoring gender; any two organisms from the population are able to mate.) Then randomly select an allele from the first parent and randomly select an allele from the second parent. Combine these two alleles to make a child. For example, suppose that you randomly selected parent1 as 'TT' and parent2 as 'tt'. You would randomly select an allele from parent1: 'T' and randomly select an allele from parent2: 't' and form their child 'Tt'. Accumulate the children into a new population using the list append method.
You can use the choice function from the random library to choose a random parent from the population, since the population is represented as a list. It's possible the choice function will choose the same parent twice, but that that's ok for this simulation.
You can also use the choice function to choose an allele from each parent because this function can be applied to strings as well as to lists. For example choice("abcde") will randomly choose one of the letters from the given string, such as 'd'.
Test your function in main before moving on to the next
part. Be sure that it returns a new population of the same size as
the original population. For example, oneGeneration(['TT', 'Tt',
'Tt', 'Tt', 'tt']) might return: ['tT', 'TT', 'Tt', 'Tt',
'Tt'].
Write a function called manyGenerations that takes as parameters:
- population: a list of organisms represented as strings
- numGenerations: the number of generations represented as an integer
Use the oneGeneration function that you wrote in the previous step to help you implement this function.
Test this function in your main program. Try creating an initial population of size 1000, using a probability of 0.5 for the 'T' allele. Use your countGenotypes function to summarize this initial population. You should see about 25% dominant, 50% mixed, and 25% recessive. Then try using your manyGenerations function on this initial population for 50 generations, and save the resulting population. Use your countGenotypes function to summarize this final population.
For example, your main should now be able to perform the following sort of interaction with the user:
Enter population size: 1000
Enter probability of 'T' allele in initial population: 0.5
Enter number of generations: 50

Initial distribution TT: 0.254   Tt and tT: 0.485   tt: 0.261
  Final distribution TT: 0.224   Tt and tT: 0.487   tt: 0.289
You should see that the proportion of each genotype is about the same. Try this multiple times. There will be significant variation using these relatively small numbers.
For a test with less variation try using a population of size 10000
and 200 generations. This may take 10 or more seconds to process.
Currently your program only reports the initial and final distribution of genotypes in the population. It would be nicer to graph the distribution across all the generations. To accomplish this, you'll need to update the manyGenerations function from the previous step.
Modify manyGenerations to accumulate three lists that maintain the counts of the genotypes (recessive, dominant, and mixed) for each generation. For example, suppose we were using populations of size 10. For each new generation, we would accumulate the counts of each kind of genotype as shown below. In generation 0, there were 4 recessive, 1 dominant, and 5 mixed. In generation 1, there were 4 recessive, 2 dominant, and 4 mixed. After simulating all of the generations, these three lists contain the history of counts for each kind of genotype in the population.
Generation: 0
Population: ['tt', 'tt', 'tT', 'tT', 'tT', 'tt', 'tT', 'tt', 'TT', 'Tt']
 Recessive: [4]
  Dominant: [1]
     Mixed: [5]

Generation: 1
Population: ['Tt', 'TT', 'tt', 'Tt', 'Tt', 'tt', 'tT', 'tt', 'tt', 'TT']
 Recessive: [4, 4]
  Dominant: [1, 2]
     Mixed: [5, 4]

Generation: 2
Population: ['tt', 'TT', 'Tt', 'Tt', 'tT', 'Tt', 'Tt', 'tt', 'tT', 'TT']
 Recessive: [4, 4, 2]
  Dominant: [1, 2, 2]
     Mixed: [5, 4, 6]

Generation: 3
Population: ['Tt', 'tt', 'TT', 'tt', 'tt', 'tT', 'TT', 'tt', 'tt', 'tt']
 Recessive: [4, 4, 2, 6]
  Dominant: [1, 2, 2, 2]
     Mixed: [5, 4, 6, 2]

Generation: 4
Population: ['tt', 'tt', 'Tt', 'tt', 'tt', 'tt', 'tt', 'tT', 'tt', 'Tt']
 Recessive: [4, 4, 2, 6, 7]
  Dominant: [1, 2, 2, 2, 0]
     Mixed: [5, 4, 6, 2, 3]
Just before returning from manyGenerations, call the
populationGraph function from the genetics library.
It expects three lists containing the recessive, dominant, and mixed
counts in that order. It will generate a graph like this when tested
on a population of size 10000, with probability of 0.5 for allele 'T',
and 200 generations:
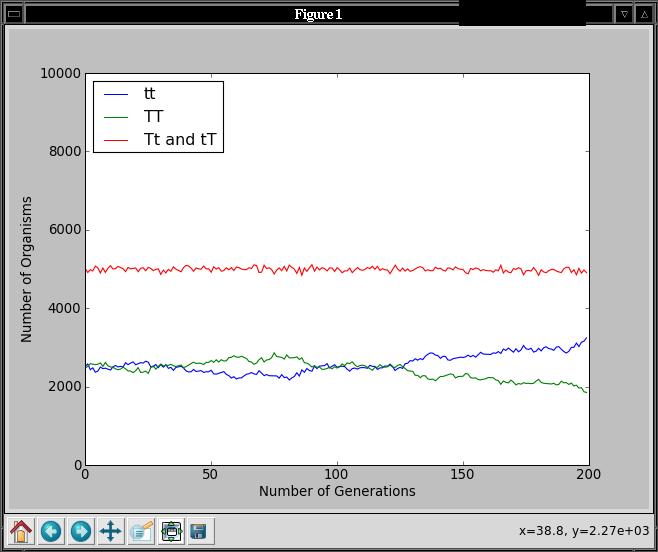
Do the percentages of each genotype remain fairly constant over
time as predicted by the Hardy Weinberg principle?
According to the Hardy-Weinberg principle, a population will remain in equilibrium only under certain conditions such as when mating is completely random. Let's explore how the proportion of genotypes in the population will change if we add preferential mating to our simulation.
Modify the main function so that it now asks the user whether or not to use preferential mating.
Modify the manyGenerations and oneGeneration functions so that they take an additional parameter. This parameter will be a boolean representing whether preferential mating should occur. When it is False reproduction will work just as before. When it is True, tall organisms will prefer tall mates and short organisms will prefer short mates. Recall that if an organism has at least one 'T' allele it will be tall, otherwise it will be short.
You should implement preferential mating as follows in oneGeneration: randomly select two parents from the population as already implemented. If they are both tall or both short, then immediately create a child as before. If they are different heights, then randomly re-select the second parent. {\bf Regardless of the new second parent's height, create a child}. That is, the first parent only gets two chances to obtain the preferred mate.
Does the population remain in equilibrium once this feature is
added?
These enhancements are not required and should only be attempted once all of the required elements described above are working correctly.
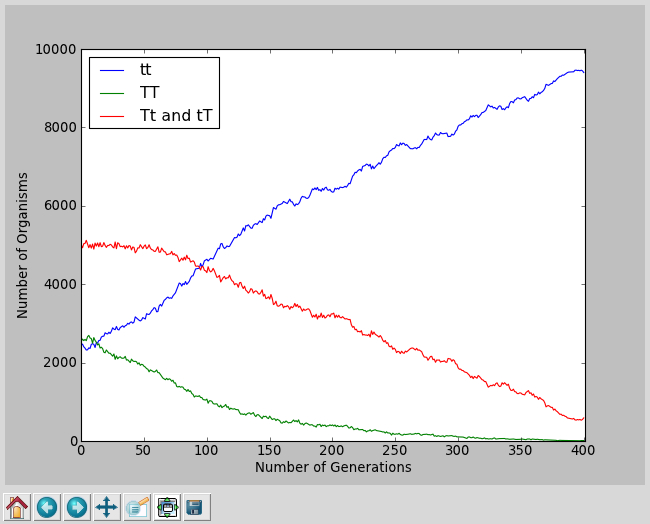
Add natural selection to kill off some percentage of a certain kind of organism every generation. For example, suppose 1 percent of short people died off each generation. How would that affect the number of organisms versus time?
Add some code to ask the user which category should be selected against (tall, short, or none) and what percentage of the population should be killed off each generation.
Enter population size: 10000
Enter probability of 'T' alleles in initial population: 0.5
Enter number of generations: 400
Use preferential mating? n
Add natural selection (against: tall, short, none)? tall
Enter percent to kill off each generation (eg, 5, 1, 0.3): 1
Initial distribution:  TT: 0.255%       Tt and tT: 0.500%       tt: 0.245%
Do you want to graph the results? y
  Final distribution:  TT: 0.001%       Tt and tT: 0.059%       tt: 0.940%
This lab was inspired by an assignment given at Harvey Mudd College
for a team-taught Biology and Computer Science course given by
professors Zachary Dodds, Ran Libeskind-Hadas, Eliot Bush, and Steve
Adolph.
Once you are satisfied with your program, hand it in by typing handin21 in a terminal window.